01
Beginner-first education
Understand market structure, trend analysis, and chart behavior without getting overwhelmed.

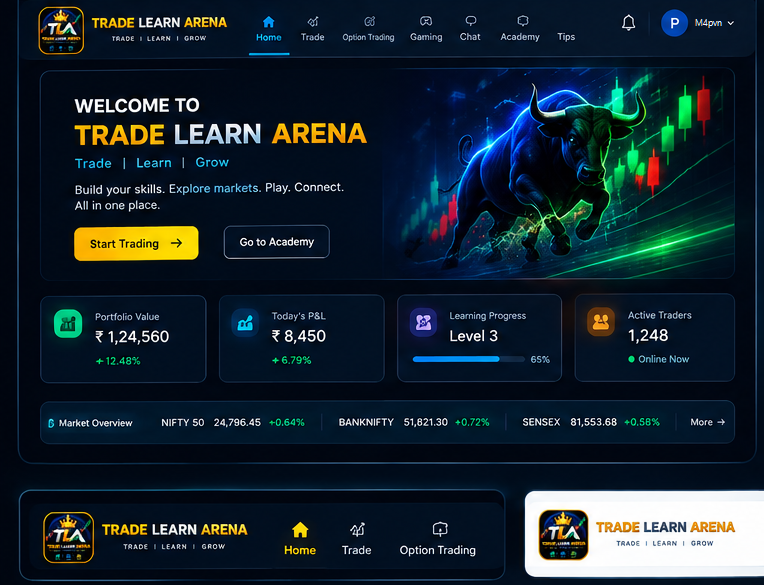
A beginner-friendly education platform for chart reading, strategy building, and disciplined trading decisions.


Understand market structure, trend analysis, and chart behavior without getting overwhelmed.
Build disciplined habits with position sizing, stop-loss logic, and calculated decision-making.
Use a paper-trading environment to test strategies and learn from every trade in real time.
₹23,772
+1.54%₹70,532
-5.83%₹55,104
Master chart patterns and indicators
Protect your capital with proper sizing
Understand leverage and margin trading
Track major indices and commodities in real time with clean, readable market cards and trend snapshots.
Learn price action, candlestick patterns, structure, pullbacks, and trade psychology in a simple format.
Practice disciplined execution with risk controls, stop planning, and mindset-driven trade habits.
Start with the basics and build confidence without being overloaded by technical jargon or complex tools.
Great insights today to join telegram all downloads are available
Next update: Intraday trading application with comprehensive notes. Stay tuned!
Important: Technical analysis is a probability-based framework, not a guarantee of profit. Risk management is more important than any individual indicator or pattern.
Technical analysis (TA) studies price, volume, and market behavior to identify potential trading opportunities.
The three basic assumptions are:
The basic workflow:
Market → Trend → Structure → Levels → Setup → Entry → Stop-loss → Target → Position size → Execution → Review
A candle contains:
Important candle concepts:
Candle anatomy:
Important individual candles: Doji, Hammer, Shooting star, Inverted hammer, Marubozu
Don't trade a candle pattern by itself. Location + trend + structure + confirmation matter more.
One of the most important concepts in TA.
Uptrend: HH → HL → HH → HL (HH = Higher High, HL = Higher Low)
Downtrend: LL → LH → LL → LH (LL = Lower Low, LH = Lower High)
Range: Price moves between Resistance ↔ Support
Key concepts:
Golden rule: Don't ask "Which indicator says buy?" Ask: "What is the market structure doing?"
Support: An area where buying interest has previously appeared.
Resistance: An area where selling interest has previously appeared.
Think of them as zones, not exact lines.
Important levels include:
Role reversal: A broken resistance can become support. A broken support can become resistance. This is called polarity or role reversal.
Trendline: Connect significant swing points. Use trendlines to identify trend direction, dynamic support/resistance, and potential breakout areas.
Channel: Two roughly parallel trendlines containing price.
But remember: A trendline break ≠ automatic reversal. Wait for structure confirmation.
Different timeframes provide different perspectives.
Higher timeframe: Daily / Weekly → overall direction
Middle timeframe: 4H / 1H → setup
Lower timeframe: 15m / 5m → entry
This is called multi-timeframe analysis.
Top-down approach: Identify higher-timeframe trend → Mark major support/resistance → Identify market structure → Look for setup on lower timeframe → Execute with defined risk.
Volume shows participation/activity.
Important concepts:
Volume is context-dependent. High volume doesn't automatically mean "Buy." It could represent aggressive buying or aggressive selling.
Common moving averages: SMA — Simple Moving Average, EMA — Exponential Moving Average
Popular periods: 20, 50, 100, 200
Uses: Moving averages can help identify trend direction, dynamic support/resistance, momentum, and trend changes.
Example: Price above a rising 200 MA can indicate a stronger long-term bullish environment. But don't blindly buy because price crosses an MA.
Relative Strength Index, usually measured from 0–100.
Traditional interpretation: Above 70 → overbought, Below 30 → oversold
But: Overbought does NOT automatically mean sell. Strong trends can remain overbought for extended periods.
RSI divergence:
Divergence is best treated as warning/confirmation, not an automatic entry.
MACD helps analyze momentum and trend.
Important components: MACD line, Signal line, Histogram, Zero line
Watch for: Crossovers, Zero-line behavior, Histogram expansion/contraction, Divergence
Again, use it with price structure rather than independently.
Common levels: 23.6%, 38.2%, 50%, 61.8%, 78.6%
Traders commonly use Fibonacci to identify potential retracement areas.
Example: Strong uptrend → price pulls back → Fibonacci zone overlaps with previous support → potentially stronger confluence.
Fibonacci is not a magic price prediction tool.
Continuation patterns: Flag, Pennant, Triangle, Rectangle
Reversal patterns: Double top, Double bottom, Head and shoulders, Inverse head and shoulders
Important principle: A pattern is meaningful only when you consider Pattern + location + volume + structure + market context
A breakout occurs when price moves beyond an important level.
Good breakout characteristics: Clear level, Strong price expansion, Increased participation/volume, Close beyond the level, Follow-through
False breakout: Price breaks a level and quickly returns inside. This is sometimes called Fakeout, Bull trap, Bear trap, or Liquidity sweep. Don't assume every breakout will continue.
Instead of buying an extended breakout, traders sometimes wait for a pullback.
Example: Resistance → Breakout → Pullback → Support → Continuation
This can provide: Better entry location, Smaller stop, Better risk/reward. But pullbacks can also fail.
Momentum measures the strength/speed of price movement.
Signs of strong momentum: Large candles, Strong closes, Volume expansion, Persistent directional movement, Shallow pullbacks
Weak momentum can show: Smaller candles, Repeated rejection, Decreasing volume, Divergence, Failed breakouts
Advanced traders often study where orders and stops may cluster.
Potential liquidity areas: Above obvious swing highs, Below obvious swing lows, Equal highs, Equal lows, Range boundaries
A liquidity sweep occurs when price moves through an obvious level and then reverses.
Important: Don't assume a sweep automatically means reversal. Look for structure confirmation afterward.
This is arguably more important than technical analysis.
Never start with: "How much can I make?" Start with: "How much can I lose?"
Risk per trade: Many traders use a predefined fraction of account equity.
Example: Account = ₹1,00,000, Risk = 1%, Maximum planned loss: ₹1,000
Position sizing: Position Size = Maximum Risk ÷ Stop-loss distance
Example: Maximum risk = ₹1,000, Entry = ₹500, Stop = ₹490, Risk per share = ₹10, Position size: ₹1,000 ÷ ₹10 = 100 shares
Suppose: Entry = ₹500, Stop = ₹490, Target = ₹530
Risk = ₹10, Reward = ₹30, Therefore: Risk : Reward = 1 : 3
You don't need to win every trade if your winners are sufficiently larger than your losers.
A trading system should be evaluated mathematically.
Expectancy = (Win Rate × Average Win) − (Loss Rate × Average Loss)
Example: Win rate = 40%, Average win = ₹3,000, Loss rate = 60%, Average loss = ₹1,000
Expectancy: (0.40 × 3000) − (0.60 × 1000) = ₹1,200 − ₹600 = ₹600 per trade
This doesn't mean every trade makes ₹600. It means the system's historical average can be positive if the assumptions remain valid.
Major psychological problems: FOMO, Revenge trading, Overtrading, Fear of taking a loss, Moving stop-loss, Taking profits too early, Increasing position size after losses, Breaking trading rules, Trying to recover losses quickly
Professional mindset: Think in terms of Probability + Risk + Execution + Repetition, Not: Prediction + Certainty
Record every trade.
Important fields: Date, Instrument, Timeframe, Setup, Entry, Stop, Target, Position size, Risk %, Result, Screenshot, Reason for entry, Reason for exit, Emotional state, Mistake, Lesson
After 50–100+ trades, analyze your data. Look for: Best setup, Worst setup, Best timeframe, Average R, Win rate, Maximum losing streak, Drawdown, Time-of-day performance
Before risking real money, test your strategy on historical data.
Define: Entry rules, Exit rules, Stop-loss rules, Target rules, Position sizing, Market/timeframe, Trading costs
Avoid hindsight bias and overfitting. A strategy that perfectly fits historical data can fail in live markets.
A high-quality setup may have several independent factors agreeing.
Example: Higher-timeframe uptrend, Support zone, Bullish structure shift, Volume confirmation, Fibonacci retracement area, Good risk/reward
This is confluence. But don't add 10 indicators simply to create the illusion of confirmation.
Different strategies work in different environments.
Trending market: Pullbacks, Moving averages, Breakouts, Trend continuation
Range market: Support/resistance, Mean reversion, Range extremes
High-volatility market: Smaller position sizing, Wider stops where appropriate, Greater awareness of slippage, More conservative execution
A strategy can fail simply because the market regime changed.
Instead of thinking only in rupees: 1R = your initial risk
If you risk ₹1,000: Loss = −1R, Profit ₹1,000 = +1R, Profit ₹2,000 = +2R, Loss ₹500 = −0.5R
This makes performance easier to compare across trades.
Drawdown measures decline from an equity peak.
Example: Account grows to ₹1,20,000, Falls to ₹1,08,000, Drawdown: ₹12,000 / ₹1,20,000 = 10%
A strategy with large drawdowns can be psychologically and financially difficult to trade.
Use this checklist before entering:
A. Market: What instrument am I trading? Is liquidity adequate? Is volatility appropriate?
B. Structure: Bullish? Bearish? Range? Transition?
C. Location: Support? Resistance? Breakout? Retest? Liquidity area?
D. Confirmation: Price action? Volume? Momentum? Structure shift?
E. Risk: Where is invalidation? How much am I risking? Is the position size correct?
F. Reward: Where is the target? What is the R:R? Is there enough room before major opposing levels?
G. Execution: What is my exact entry? Stop? Target? What would make me cancel the trade?
If you're studying TA, prioritize these: Market structure, Support & resistance, Trend identification, Candlestick/price action, Breakouts and false breakouts, Pullbacks/retests, Volume, Multi-timeframe analysis, Risk management, Position sizing, Risk/reward, Expectancy, Trading psychology, Backtesting, Journaling, Market regimes, Confluence, Drawdown management
Good trading ≠ predicting every move.
Good trading = Edge × Risk Management × Discipline × Consistent Execution
Protect capital first. Find the edge second. Scale only after proving the edge.
If you're learning from scratch, a sensible progression is Candlesticks → Market Structure → Support/Resistance → Trend → Volume → Price Action → Risk Management → Strategies → Backtesting → Advanced concepts.
Risk management is the process of identifying, analyzing, and controlling risks that may cause loss or problems to an organization.
Identify Risk: Find out what problems or risks may occur.
Analyze Risk: Understand the chance and impact of each risk.
Control Risk: Take steps to reduce or prevent the risk.
Monitor Risk: Regularly check whether the risk controls are working.
Review: Update the risk plan when situations change.
Financial Risk – Loss of money.
Operational Risk – Problems in daily activities.
Legal Risk – Failure to follow laws or rules.
Technology Risk – System failures or cyber threats.
Strategic Risk – Poor decisions affecting business goals.
Risk management helps an organization avoid losses, protect resources, improve decision-making, and achieve its goals safely.
What is Futures Trading? Futures trading means buying or selling a contract whose value is based on an underlying asset such as an index, stock, commodity, currency, or cryptocurrency. You can take a Long position if you expect the price to rise or a Short position if you expect it to fall.
LONG: Expect price ⬆️ → Buy → Price rises = potential profit
SHORT: Expect price ⬇️ → Sell → Price falls = potential profit
Long: (Exit Price − Entry Price) × Quantity
Short: (Entry Price − Exit Price) × Quantity
Example: Entry ₹100 → Exit ₹110 → Quantity 100 → Profit = ₹1,000 (before applicable trading costs)
Leverage can magnify losses as well as profits. Margin is not necessarily your maximum possible loss. Always understand the contract's specifications, margin requirements and settlement rules before trading.
Before every trade, decide: Entry → Stop-Loss → Position Size → Maximum Risk → Exit Plan
Never risk money you cannot afford to lose. Avoid increasing your position just because you had a losing trade.
Learn: Support & Resistance, Market Structure, Trends & Breakouts, Candlesticks, Volume & Open Interest, VWAP, RSI, Moving Averages, ATR & Volatility
Stay disciplined. Don't trade because of FOMO 😨, anger 😡, greed 💰, or revenge trading 🔥.
Keep a trading journal and record your entry, exit, reason, risk, P&L and mistakes.
"Protect your capital first. Profit comes second." 🛡️💰
Remember: Futures trading is high-risk because of leverage. Learn, practice with a simulator/paper-trading account, understand the contract rules, and only then consider risking real money.